
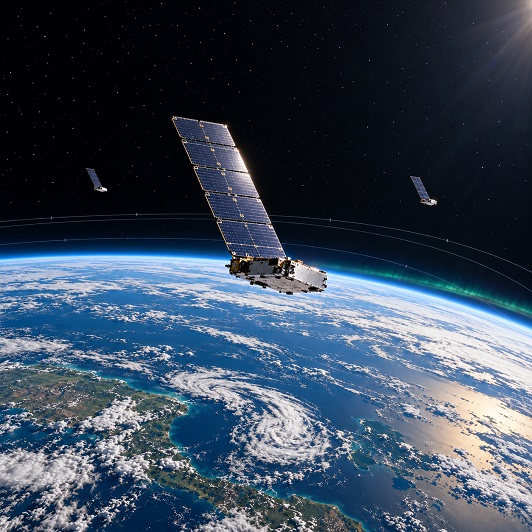
Starlink Satellites Become A ‘Planetary Barometer’
Astronomer Dr Tony Phillips is using satellite tracking data to monitor changes in Earth’s upper atmosphere, turning Starlink and other satellite fleets into an unexpected measuring tool that could help explain the conditions affecting spacecraft hundreds of kilometres above us.
Why Watch Satellites Sink?
Satellites may appear to travel through empty space, but those in low Earth orbit still encounter traces of Earth’s atmosphere. That thin air creates resistance, gradually reducing their orbital energy and bringing them closer to the planet unless thrusters compensate.
When solar activity heats the upper atmosphere, known as the thermosphere, it expands, increasing air density at satellite altitudes. Spacecraft then experience more drag, making their changing orbits a useful source of information about conditions that are difficult to measure across such a large area.
Phillips, who runs the Spaceweather.com website, has used this relationship to produce a daily satellite-drag index. As he explains, “No instrument was launched for this. The swarm itself is the sensor, read from public tracking data.”
What Does The Number Mean?
The index estimates how much altitude a typical Starlink satellite at 480 kilometres would lose in a day if its thrusters were switched off. A reading of 30 metres therefore describes an estimated daily descent under those conditions, rather than showing that every operational satellite actually fell that distance.
According to Spaceweather.com, the calculated rate ranged from 19.7 metres per day on 10 August to 127.6 metres during a geomagnetic storm on 20 January, a difference of more than sixfold.
Although Phillips calls the system a planetary barometer, it actually concerns atmospheric density rather than the pressure measured by a conventional weather instrument. It also describes conditions high above Earth, so it shouldn’t really be confused with a tool for predicting tomorrow’s rain.
How Is The Reading Calculated?
The method uses publicly distributed orbital records called two-line element sets, or TLEs. These describe satellite orbits and contain a fitted drag term known as B-star, which helps an orbital model match tracking observations.
Changes in that term can reflect changes in atmospheric conditions, although individual readings are affected by modelling limitations and satellite manoeuvres. Phillips therefore follows a fixed sample of 1,000 Starlinks, comparing each satellite with its own quieter conditions and combining the results.
His explanation captures why the group matters more than any individual spacecraft, saying, “The median of hundreds of satellites is the instrument.” Using the middle value helps limit the influence of unusual readings, although it cannot remove every source of uncertainty.
Other Satellites Help Check The Results
One of the difficulties Phillips faces is that Starlink satellites use thrusters to maintain their orbits, making it harder to separate the atmosphere’s effects from the spacecraft’s own movements. To check his readings, he turned to 107 Planet Labs SuperDoves, small Earth-imaging satellites that have no thrusters and therefore cannot push themselves back up.
During January’s storm, the SuperDoves descended at roughly 2.74 times their previous rate, closely matching the 2.71-fold increase shown by the Starlink index. According to Spaceweather.com, that agreement provides evidence that the index was picking up the storm’s effect on the atmosphere, rather than simply changes in how SpaceX operated its satellites.
Phillips also monitors Amazon’s Kuiper and Eutelsat’s OneWeb fleets, extending the comparison to different heights. Together, these observations help show how far the atmosphere’s response reaches, with satellites in lower orbits experiencing stronger drag and the much higher OneWeb fleet showing a smaller response.
Why Space Weather Matters
Knowing how much the atmosphere is slowing satellites could help operators calculate their future positions more accurately, making it easier to judge collision risks and decide when to use thrusters to maintain an orbit. Better information could also help avoid unnecessary manoeuvres, saving the limited propellant that spacecraft need to remain operational.
The consequences of getting those conditions wrong can be substantial. In February 2022, increased atmospheric drag contributed to the loss of 38 newly launched Starlink satellites, showing why operators need to understand how solar activity changes the environment their spacecraft fly through.
Phillips’ daily public index could help by giving researchers and operators another way to check whether their atmospheric models match what satellites are actually experiencing. Over time, those comparisons could help improve the models used to plan launches, predict orbits and protect spacecraft, without requiring a dedicated monitoring satellite.
However, the index measures recent conditions rather than warning of an approaching storm. The tracking data takes time to become available and combines observations over one to three days, smoothing out sudden changes, so its immediate value lies in checking and improving understanding of the atmosphere. As Spaceweather.com explains, “the number describes yesterday’s air”.
What Does This Mean For Your Business?
For businesses relying on satellite broadband or Earth-observation services, this story highlights a physical dependency behind apparently seamless digital connections. A high drag reading doesn’t automatically mean a service will fail, but organisations with critical satellite links should understand their provider’s resilience arrangements and retain suitable alternatives where an interruption would stop essential work.
For satellite operators, additional observations could actually help assess atmospheric models, although this index would need further validation before being relied upon for operational decisions. Its delayed readings and sensitivity to spacecraft behaviour mean it should complement established monitoring and forecasting rather than replace them.
There is also a broader lesson here about making better use of information already being collected. Equipment logs, movement records and performance data may reveal conditions beyond their original purpose, but useful patterns need independent checks and a clear explanation of their limits before they become a sound basis for business decisions.